BP Manual 06-Preprocessing in low frequency band
Contents
Now, all the preparations have been done. Let’s start the key part of back-projection.
We often cross correlate waveforms in a relatively lower frequency band, and then crosse correlate for a higher frequency bands again. This two-step procedure gives a good high-frequency station correction and avoids errors that may be caused by cycle slip in the higher frequencies.
Copy all seismic files that have been checked in the Chapter 2, make sure that there are not repeating stations and all files have an equal delta. The grid points have been set up in the Chapter 3. The model seismogram has been picked up, and some parameters set in the Chapter 4 are applied here.
The travel times between grid points and all stations are calculated using the 1-D global velocity model IASPEI 19911. In order to overcome the structure heterogeneities beneath stations that are not taken into account in the IASPEI 19911 velocity model, we apply a station correction procedure to further improve the travel time calculations.
$ csh back-projection_1.csh
# open back-projection_1.csh to look over all commands
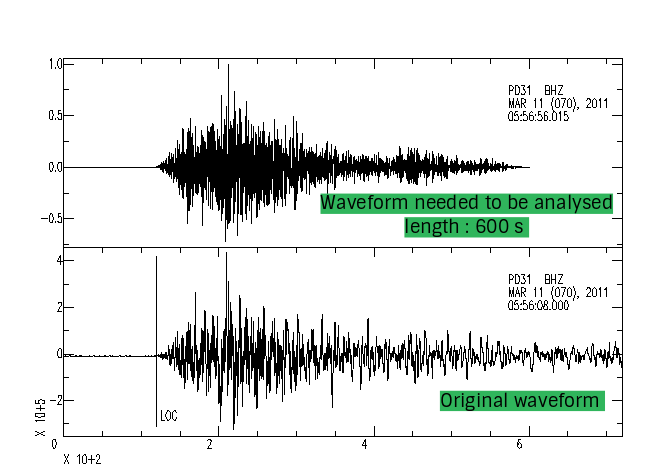
Capture P waveforms
Capture P waveforms recorded at the vertical component, from the whole waveform to avoid interference of later waves; The step mainly works for stacking amplitudes (discuss later).
- First, we can roughly estimate P wave length by travel-time software Taup.
$ taup
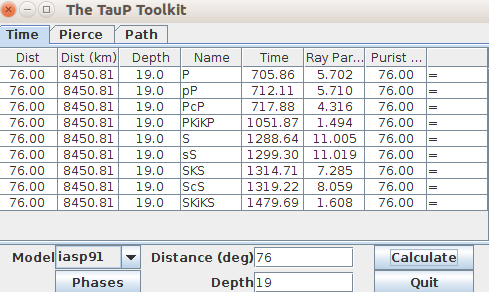
- S wave fall behind P direct wave over 500 s, and plusing P wave arrival time in our SAC file, whick is about 120 s, the final waveform lenth we need analysed can reach over 600 s.
set P_length = 600 # length of waveform for stacking later
Process waveforms
Deal with waveforms basically: filter, remove mean, taper, and normalize.
Set parameters for back-projection.

set cl            = 0.5        # upper bound of low frequency band
set ch            = 0.05       # lower bound of low frequency band
set nsam          = 40       # sampling; 1/delta

set window_length = 10       # length of window for cross-correlation
set lag_lenth     = 5        # length of time shift
set cc_min        = 0.6      # minimum of cross-correlation to eliminate bad data
Align P onsets
Take model station as refrence, preliminarily align waveforms according to theoretic P arrival time from grid points to stations. Each station’s P wave onset comes from the first grid (epicenter), which is considered as the initial point of source rupture. Model station’s waveform is fixed, and align all P onsets by shifting others, which is to cancel out influnce of various epicentral distances in theory.
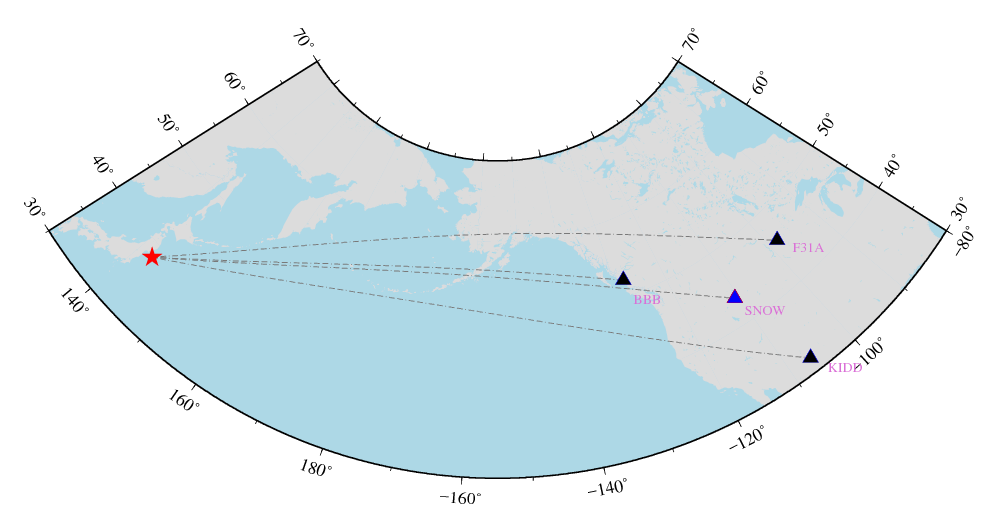
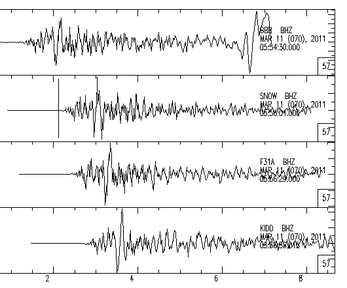
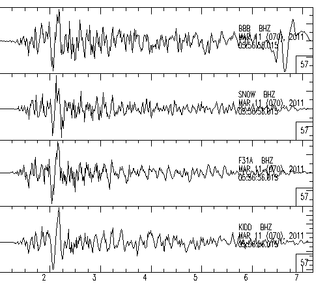
The upper firure indicates spatial relationship between event and four stations. The model station named SNOW locates in the most central position. Left and right figure below show original wavefoems and aligned waveforms by travel times.
# Open stack_raw-EU.f to view details
Cross correlate
Calculate cross-correlation between each station and model station. Including epicentral distance, structure heterogeneity beneath stations may affect travel times. Therefore, we apply station correction to account for the structure heterogeneities that is not considered in calculating travel times.
At first, calculate waveforms’ corss-correlation between model station and others with a window length.
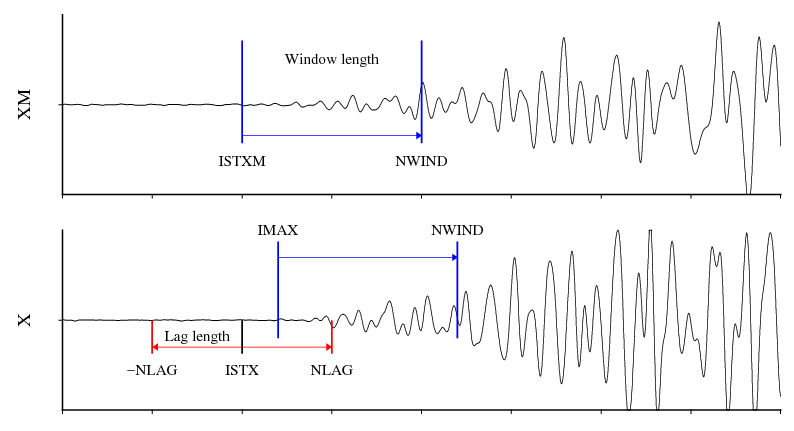
SUBROUTINE COHERE(XM,X,ISTXM,ISTX,NWIND,NLAG,COHMIN, IMIN, COHMAX,IMAX)

C      CROSS CORRELATE XM AND X (XM IS MODEL, X IS DATA TO TEST)
C      ISTXM, ISTX = STARTING INDICES TO CROSS CORRELATE
C      NWIND = NO. OF SAMPLES IN WINDOW TO CORRELATE
C      NLAG = +/- NO. OF LAGS TO TRY, SO 2*NLAGS + 1 ARE TESTED

C      OUTPUT:
C	   COHMIN = SMALLEST COHERENCE AT LAG IMIN
C      COHMAX = LARGEST COHERENCE AT LAG IMAX

DIMENSION XM(1), X(1)

COHMIN = 1000000.
COHMAX = -1000000.
NLAGS = 2*NLAG + 1
DO 120 I=1,NLAGS
   ILAG = (-1 * NLAG) + I - 1
   TOT = 0.
   FNORM1=0.
   FNORM2=0.
   DO 125 J = 1,NWIND
      IF((J+ILAG+ISTX).LT.1) GOTO 125
      TOT = TOT + XM(J+ISTXM)*X(J+ILAG+ISTX)
      FNORM1 = FNORM1 + XM(J+ISTXM)**2.
      FNORM2 = FNORM2 + X(J+ILAG+ISTX)**2.
   125 CONTINUE

   TOT = TOT/(FNORM1*FNORM2)**0.5

   IF(TOT.GT.COHMAX) THEN
      COHMAX=TOT
      IMAX = I
   ENDIF

   IF(TOT.LT.COHMIN) THEN
      COHMIN=TOT
      IMIN = I
   ENDIF

120	CONTINUE

IMIN = IMIN - NLAG - 1
IMAX = IMAX - NLAG - 1

RETURN
END
# Open stack_raw-EU.f to view details
And then, shift waveforms according to maximum cross-correlation. We have known largest coherence at lag IMAX. With them, shift waveforms to align P onsets again.
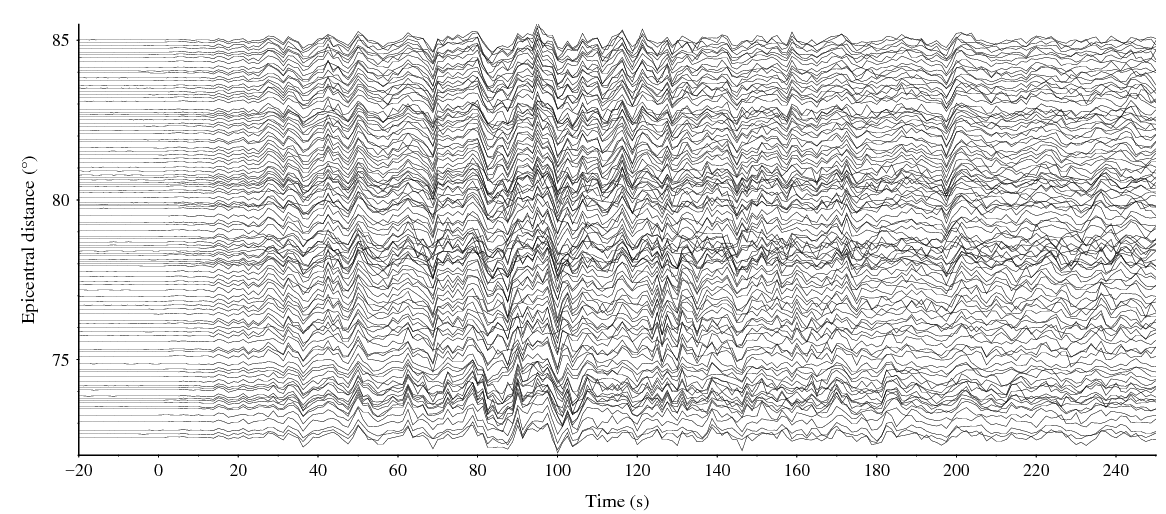
Above figure shows aligned waveforms, and time 0 is P wave arrival time of model station.
# Open stack_raw-EU.f to view details
-
Kennett B L N, Engdahl E R. (2010), Traveltimes for global earthquake location and phase identification[J]. Geophysical Journal of the Royal Astronomical Society, 105(2):429-465. ↩︎
Author Qiang
LastMod 2018-10-24