BP Manual 04-Setting up grid
Contents
In a way, back-projection can be recognised as the method of grid search.
First, we set up suitable grid points around epicenter, and hypothesize these points are all possible source locations. Then, seismograms are stacked for each possible source location to obtain a direct image of the source. Then sum the energy that is radiated from the given source constructively, and cancels out other energy present in the seismograms. Finally, those points having largest energy make up event’s rupture process.
The relative locations of the back-projection results do not depend strongly on the assumed epicenter. There is also only a small dependence of differential arrival times as a function of depth, so, for all shallow (focal depth ≤ 60 km) earthquakes, we use a fixed depth of 15 km for all the source locations and travel time table, which is going to be discussed later.
Setting up grids
Only six basic parameters are needed to set up. First, earthquake’s location (longitude,latitude), whick is the base of all grid points. Then you need set up the interval between points. Last, they are number of grid ponits in four directions (along and perpendicula strike).
set hypolon = 142.498      # epicenter's longitude
set hypolat = 38.2963      # epicenter's latitude
set az      = 23           # angle from north, the positive dir along strike

set gridint = 10      # space interval between points

set nstrike1 = 20     # no. grid points in positive dir along strike
set nstrike2 = 30     # no. grid points in negative dir along strike
set nperp1   = 10     # no. grid points eastward to hypocenter (east)
set nperp2   = 20     # no. grid points westward to hypocenter (west)
If you can’t make sure that how grid points distribute is the most appropriate because of lacking information of fault distribution, one way is trying a few times until get a satisfied result. Or set up extensive enough points area to ensure given points can cover source rupture area.
$ csh Make_grid.csh
# open Make_grid.csh to look over all commands
Look over distributions
If needed, we can look over distributions of stations, grids and event(s).
$ csh Figure.gmt
# open Figure.gmt to look over all commands
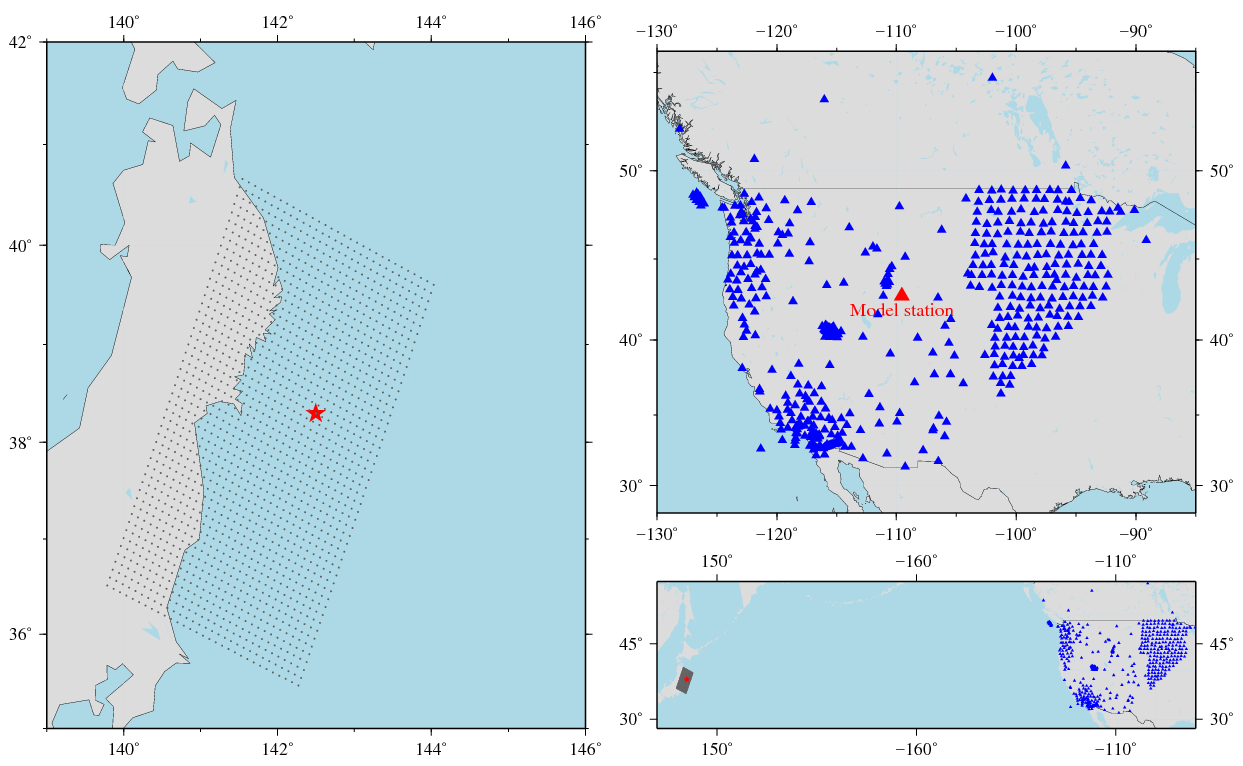
Left figure: location of 2011-03-11 great Tohoku earthquake and preliminary distribution of grid net; Upper right: location of seismic array in US; Lower right: overview of above information.
Author Qiang
LastMod 2018-10-24